Zaki Bouaoudia

Project Portfolio
About Me
Welcome! I’m Zaki, a recent Georgetown University graduate passionate about leveraging data for insights, problem-solving and driving informed decisions. I’m seeking a full-time role as a data analyst or data-related role in New York City. This portfolio showcases my experience and skills in data analysis, visualization, and programming.
Technical Skills: Excel, SQL, Tableau, Python (Pandas and Matplotlib libraries) and APIs
Education
- Bachelor of Science in Business Administration - Georgetown University (Aug 2020 - May 2024)
Relevant Coursework
- Data Visualization in Tableau
- Developing and Managing Databases in SQL
- Introduction to Python
- Modeling Analytics in Excel
- Management Business Application Development in Python
- Final Project: Cooking Buddy App (details below)
Projects
European Soccer Leagues Analysis Using SQL
Analyzed European soccer data across five major leagues (Premier League, La Liga, Bundesliga, Serie A, and Ligue 1) using SQL. Through complex queries, I extracted insights about team performance, player statistics, and league competitiveness from 2014 to 2020. Key analyses include analyzing home vs. away performance, tracking goal-scoring patterns, calculating team points distributions and evaluating league competitiveness through points gaps.
The project demonstrates proficiency in SQL, including CTEs, subqueries, window functions, set operations and complex joins. I handled the full project lifecycle and infrastructure: from SQLite database setup and CSV data ingestion, to database management and export for data visualization in Tableau, available on my Tableau Public Profile.

IMDb Movie Ratings Analysis in Python (using Pandas and Matplotlib)
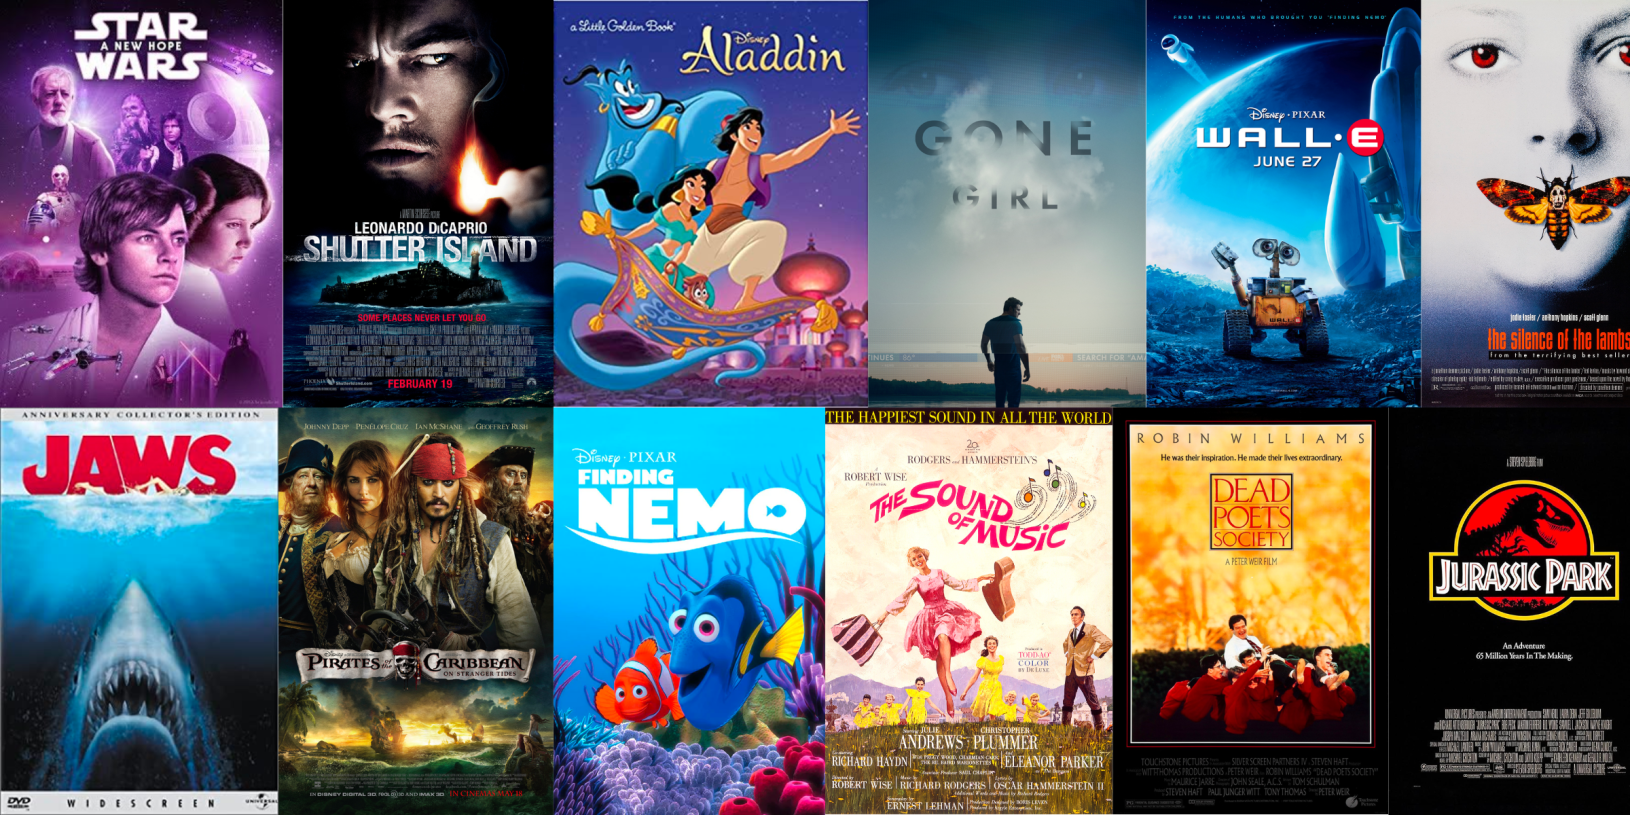
I conducted an in-depth analysis of IMDb movie ratings for films released over the past century (1920-2023). The objective was to uncover trends and patterns in movie ratings over time, with a particular focus on how ratings vary across genres.
The project entailed extensive data cleaning, transformation, and manipulation using Python and the pandas library. Key tasks encompassed renaming columns for clarity, converting data to appropriate types, handling missing values, and filtering the dataset to focus on movies with at least 278 ratings (i.e top 75th percentile) to ensure statistical robustness. Additionally, I split the genres column into multiple rows for genre-level analysis and added a new column grouping movies by decade for deeper insights.
The project centered on analyzing trends in movie ratings over decades, visualizing the data with matplotlib and seaborn initially, and then in Tableau for more advanced analysis. It also included genre analysis, comparing average genre ratings over time to identify shifts in popularity. Correlation analysis further revealed how closely each genre’s ratings align with the overall trend, offering insights into their relationship with movie ratings.
Interactive Tableau visualizations are available on my Tableau Public Profile.
Data Visualization in Tableau
My Tableau Public Visualizations
Developed 8 visualizations as part of my European Soccer Leagues Analysis and IMDb Movie Ratings Analysis projects. Created 2 detailed stories highlighting key findings and insights. Designed 6 dynamic dashboards with customizable filters to cater to diverse user needs and granular level analysis. The visualizations include stacked bar charts, dual-axis charts, heatmaps, treemaps, and histograms, leveraging advanced Tableau techniques such as calculated fields, LOD expressions, and parameters.
Cooking Buddy Web Application Using Python
| GitHub Repo Link | Cooking Buddy Web App |
Cooking Buddy is a flask-based web application I built with two classmates as the final project for my Management Business Application Development in Python university class. As college students with limited experience cooking, we decided to create an app to help students discover recipes based on ingredients they have available.
Users can input their available ingredients and apply filters for meal types (breakfast, lunch/dinner, snacks) and dish categories (appetizers, main courses, desserts), and receive personalized recipe suggestions complete with ingredient lists, nutritional information, and cooking instructions.
Built with Python and Flask, the application leverages the Edamam Recipe RESTful API for comprehensive recipe data, while utilizing Bootstrap 5 for a responsive, user-friendly interface. The project demonstrates skills in project management, API integration, and full-stack development.